The Challenges: Business Adoption of Analytic Models
In order to increase business adoption of analytic models, there is a great deal of work that must occur in addition to model development, and it extends well beyond the model development team.
- First, businesses need to establish connections between model scores and business decisions. This connection usually takes place outside the analytics team building the model.
- Second, the data structures and systems used by model developers for building models are often different from the one that will be used for implementing in production. Adaptation of the model asset into production should incorporate these differences.
- Third, businesses must be able to easily interpret, assess, and catalogue the model scores and the changes in scores over time on an ongoing basis.
- Fourth, to deploy and execute these models in a production information technology environment and in the field requires diligence, planning, design, execution, and quality assurance practices that are not commonly adopted by model developers.
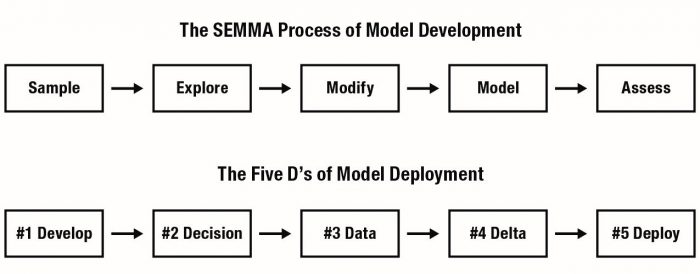
The Five Ds of Model Deployment
The purpose of this chapter is to provide a set of best practices for analytic model deployment, organized into five phases that we’ve nicknamed the “Five Ds.” They are,
- Develop: Developing and packaging models
- Decisions: Tying operational business decisions to model scores
- Data: Operationalizing analytic model deployment in a specific data architecture
- Delta: Monitoring the workflow and numeric performance of analytic models in the field
- Deploy: Implementing analytic models via a software development life cycle
1. Develop: Model Deployment and Packaging
The process of analytic model development has been active in practitioner circles for more than 10 years. As a result, some standard practices have emerged. In the financial services industry, for instance, it is commonplace to find analytics teams recognized within the risk management, marketing, pricing, and compliance functional departments. Analytic segmentation and prediction models are now relatively easy to build, given the abundance of analytics tools available on the market and via the open source movement.
Businesses typically populate analytics data structures with several years or more of historical information, and model inventories can climb to more than fifty models. The SEMMA and CRISP-DM process standards are two relatively similar formalizations of practices that analytics practitioners follow in the construction of most analytic models.
At the time these process standards were developed, few analytics practitioners had sufficient experience or perspective in the skills, processes, and techniques needed to operationalize these models. Most of the focus in the academic and professional literature tended to center around analytic algorithms, workbenches, and data structures. Researchers emphasized statistical model performance over computational speed or the feasibility of implementing those models in a commercial-class information technology infrastructure.
A few years ago, at an industry analytics conference sponsored by SAS® Institute, I asked for a show of hands to the question, “How many of your IT departments support the use of SAS® code in your production computing environments?” Fewer than five out of roughly eighty people in the room raised their hands. This was indicative of the lack of support and shared practices for analytics-focused tools in IT departments of large businesses at that time.
To remedy this, Corios recommends model developers allocate more time and effort to consistently package the model assets they build. This includes documentation of model structure and performance at the point of development as well as a more formal set of package standards that IT can use to receive and implement these models in a production environment.
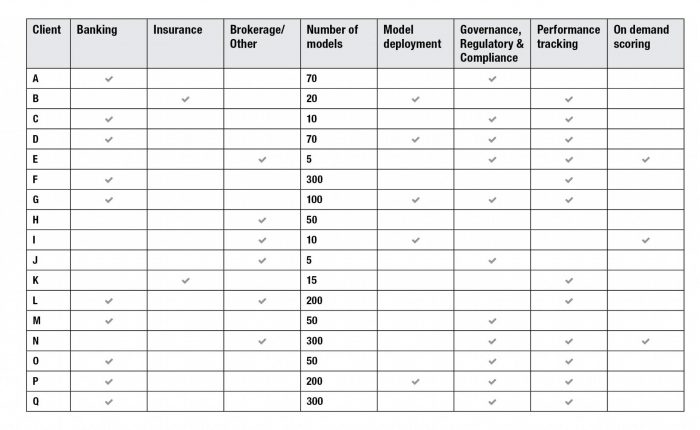
The following table provides some directional guidance from within the financial services industry to characterize demand for model inventory management. These cases are based on Corios’ direct experience in supporting these firms. Hence, this evidence is only directional and not representative of the industry as a whole. These companies maintain model inventories that are fairly substantial in terms of the number of model assets being managed, compared to similar inventories five years ago. Governance, regulatory compliance, and performance-tracking factors are neck and neck as the most compelling drivers of adoption of these practices.
Lessons Learned from Field Experience with Model Development
- Analytic model developers must understand the capabilities and limitations of the IT production facilities, standards, and field business process before they begin serious model development efforts that may be deployed.
- Take time to educate IT in the tools that the analytics team uses as well as your assumptions about the field process generating the data and the nature of the data structures you build around them.
- Determine model development tools that are flexible for deployment in a number of contexts and under changing data standards. The tools you use and the models you build should be robust.
2. Decisions: Tying Operational Business Decisions to Model Scores
The typical output of a model, usually called a “score,” is essentially a ranking or estimation of the most likely business outcomes, such as the most likely customer behavior in response to a stimulus (or the absence of a stimulus).
A score is not a decision. A decision is the proactive response of the business to the prospective customer behavior, usually involving the expenditure of resources and the monitoring of the performance of this decision. In a financial services setting, examples of these decisions include marketing, sales and service contacts with customers, debt recovery activities, and financial crime prevention decisions. Outside of the financial services industry, comparable examples of decisions are markdown and assortment in the retailing market, pricing and contract design in the telecommunications industry, preventive care program development, and outreach in the health care provider industry.
Construct a virtuous, evidence-based cycle to make the best decisions. This is characterized by defining connections between decisions, treatments, contact strategies, test-and-learn controls, and execution mechanisms.
Since decisions based on models consume resources (e.g., budget, channel capacity, customer attention span, people in the field), firms should ensure these investments are prudent and the best decision has been made, given the information available at the time. This prudence gives rise to A/B testing. However, most businesses in a practical setting have more than just two decision alternatives to make. Test-and-learn practices are the more mature option for businesses that are willing to make the tradeoffs between short term stimulus-response measurements and longer-term testing strategies that maximize the value of information.
Many organizations have developed rules-based approaches for capturing the decisions to be made in the field. Unfortunately, most rules-based approaches fall short on measuring decision tradeoffs, optimizing for the ideal profit-maximizing outcome, and evaluating short-term versus long-term benefits of each decision. This recognition within leading analytics organizations has led to the adoption of mathematically optimizing rule engines. These optimization engines place all possible decisions on a level playing field and allow the business to observe the tradeoffs of competing decision strategies directly and simply as measured by a condensed, internally consistent set of objectives.
At design time, business analysts should specify the goal-seeking objective along with a set of rules regarding resource cost and availability, product goals, and customer contact strategies. From there, they can save and execute the collection of these rules as a scenario. Once analysts have designed and run several such scenarios, they can determine which scenario is the champion and use this scenario to allocate offers and treatments to all eligible customers. Alternative designs can allocate this treatment-allocation strategy as an on-demand scoring approach (read on for more coverage of on-demand scoring).
Lessons Learned Tying Model Results to Decisions
- The best rules systems implement business rules based on judgment and experience as well as rules that prescriptively advise the SME on the tradeoffs between alternatives in pure dollars-and-cents terms.
- The best performing offers and treatments are not the ones you will issue tomorrow. Instead, they will be the offers that your organization has refined over multiple waves of disciplined, rigorous trials paired with conscientious measurement.
- Business teams that commit resources to decisions will require the most convincing about the veracity of the analytic model results. Ensure your analytic story about the findings and recommendations of the model are well suited to these groups. Explain the nuances of customer behavior in terms that resonate with your audience. Find a willing listener from that constituency to help you develop your explanations in advance of the big presentation.
3. Data: Operationalizing Analytic Model Deployment in a Specific Data Architecture
When the field of analytic model development arose, the typical data architecture for model development emphasized the construction of offline, highly customized model development data sets, usually in analytics-centric platforms. This was driven by the preferences, skills, and experience of the model development team.
Since this analytics development-driven data structure didn’t often coincide with the data architecture used by the rest of the business, model scoring activity was consequently owned by the model development team. Scores were delivered in batch cycles from the analytics team back to the IT team for loading onto the warehouse and other production systems.
This arrangement worked when there were fewer than 10–20 models, the refresh cycles for new model scores fit into that batch window, and the data exchange mechanism for data file export-import was consistent with the use of these scores in the field. However, these conditions were not acceptable or sustainable for many leading organizations: they began to desire larger pools of models, more rapid refresh, and innovative methods of model scoring.
Four major data platform technology innovations have been introduced to meet these challenges: in-database analytics, in-memory analytics, over-time analytics, and on-demand scoring. These advances are compelling because the trend in cost for data storage, data processing, largescale memory, and inter-application messaging have not increased at the same rate as the trend in cost for skilled, experienced analytics professionals. The latter resource continues to be in scarce supply compared to demand. The retention risk of analytics professionals is a continuing challenge whereas capital investments in data appliances and memory tend to stay level.

In-database analytics are motivated by moving the analytics into the data warehouse. This is in contrast to the more conventional process of extracting data from the warehouse, moving it to the analytics platform, scoring records, and then moving the scores back to the data warehouse. Companies can focus the scope of in-database analytics on the construction of the model development and model scoring data tables, the construction of the model, and the model scoring routine. In-database analytics saves clock time, increasing customer responsiveness when rapidly changing customer behavior (and consequently the data refresh cycle) demands moving from monthly to weekly to daily refreshes.
The most compelling case for in-database analytics is when models directly take advantage of customer-transaction level details, capturing changes in customer behavior. When the volume of transaction details is in the tens of millions to billions of customer records, extract-score-import cycles typically cannot scale computationally to the refresh cycle desired by the business.
In-memory analytics are a more recent technological innovation. This technology emphasizes loading data and the analysis function into memory in order to dramatically cut processing time.
While some open source analytics platforms have always leveraged in-memory analytics for model development, they tend to be weak on the model deployment front. Hence, they aren’t the focus of this discussion.
In-memory analytics are indeed blazingly fast, with processing times in the milliseconds. Nonetheless, analytics processing has always been relatively fast when compared with the gray-matter processing required by the analyst to specify hypotheses, render judgment, and balance science with art. The most compelling case for in-memory analytics appears to us to be when super-fast processing is embedded into a business analytics process that properly leverages it. One context is real-time numerical visualization. Another is real-time distributed business decision support.
In contrast to the most common set of cross-sectional classification and estimation models used by financial services companies, over-time analytics focuses on changes in patterns over time. Techniques that leverage this analytic approach include time trending, transaction sequences, and time series forecasts. Technologically, over-time analysis is distinct from in-database analysis because over-time requires physical sorting of the records in the analysis data file (a capability that is not possible with distributed databases). Over-time analysis is also distinctive because the dynamics of over-time model development and scoring are often more sensitive to small changes in the model specification than cross-sectional models. In addition, they require more intensive validation by analytics developers.
We have found that everyone’s definition of realtime varies as widely as from “twenty milliseconds” to “nightly” with the greatest concentration of expectations in the sub-second to sub-five-minutes mark.
On-demand scoring is the final innovation worthy of note. While some business teams like to refer to this activity as “real-time scoring,” we have found that everyone’s definition of realtime varies as widely as from “twenty milliseconds” to “nightly” with the greatest concentration of expectations in the sub-second to sub-five-minutes mark. On-demand probably deserves to refer to the customer’s expectation given the context.
There are several reference architectures and plenty of highly customized approaches to delivering on-demand scoring, but the most popular and most flexible option is the web services approach. Web services are used for inter-application communication on a broad scale, and the skill set for designing interfaces that use them is relatively plentiful.
Think of a web service interaction as a call and response. A point of sale system—such as a call center automation system—will send a message (the web service request) to an analytics server. It provides information such as the client ID, the type of model to score, and the attributes about the customer needed to calculate the score that isn’t available elsewhere (and, preferably, all the information about the customer that is needed to calculate the score). Once the analytics engine receives the request, it calculates the score, generates additional information, such as treatment or offer configuration details, and sends this along with other relevant information back to the call center system (the web service response). When properly designed, the call-and-response system can occur in a sub-second interval, depending on how much work the analytics server needs to do to calculate the requested information.
Lessons Learned from Experience with Innovative Data Architectures
- Each of these innovations brings a great deal of promise, assuming that the fit-to-purpose of the technology to the business process is a good one.
- In-database analytics is typically a good fit when the organization maintains very large data files (e.g., customer records in the tens of millions and/or transaction records in the hundreds of millions) and has already made a commitment and/or investment in commercial-class data appliances. The value of in-database analytics applies equally well to the functions of analytic database development, model development, model scoring, and model deployment.
- In-memory analytics is likely a good fit when the organization has many different choices to make across many scenarios, needs a low-latency connection to a large pool of historical data, prefers to work with the data visually, and needs to embed substantial analytics richness and power in the analysis process. Good examples include identifying the drivers of product profitability or conducting scenario-based uncertainty analysis.
- Unfortunately, over-time analytics seems to receive fairly limited visibility despite its usefulness. Time series analysis and forecasting have been available techniques for decades but in the financial services industry, at least, they appear to have been relegated to the economic forecasting department. More recently, in the banking industry, delinquency and loss forecasting tied to stress testing have emerged driven in part by the Federal Reserve’s mandate for capital liquidity analysis. This type of analysis is simply good business and should have broader adoption by more companies. These techniques, for instance, support analyses like customer lifetime value (by way of survival analysis) as well as new product adoption (by way of Bass adoption curve analysis).
- On-demand scoring is the least-understood technique in the bunch, due in part to its technical complexity, but these barriers are disappearing fast. In addition to dealing with the technology issues, businesses also need to construct quality assurance programs for measuring the flexibility and robustness of real-time scoring mechanisms to situations they didn’t anticipate or capture in the historical data used to train those models. In order to increase adoption, analytics teams should invest in significant outreach to explain how their models work to the field teams that will use them.
4. Delta: Monitoring the Workflow and Numeric Performance of Analytics Models in the Field
Recently, a sharp uptick in the demand for analytics model inventory tools and practices has emerged in the financial services business. This has been driven in part by recent legislative and regulatory pressure. Many of these organizations had been following a relatively informal approach of tracking their model inventories with spreadsheets but found that keeping up with periodic updates of their model assets, ongoing review and approval, and robust monitoring of performance became too much to track in such a fast and loose manner. Furthermore, regulators and internal reviewers expect to see evidence of well-built practices and processes for transparency and governance, with which informal tracking systems are incongruent.
Businesses in all industries must be able to document the scope, ownership, quality assurance, approval and sign-off, and life cycle of a model asset. These life cycles are often characterized by a standard workflow within an organization consisting of multiple steps of review at multiple levels in the organization. If a model fails a review, an iterative process of findings and limitations identification, resolution, documentation, re-review, and re-approval follows. Companies should track all of this activity so there is a good audit trail and reporting mechanism tailored for the process.
Businesses also need to understand the model’s insights, including the interpretation, defensibility, and identification of the best business actions to take based on a model score. The Bank of International Settlements published guidelines in 2005 related to credit risk model validation and measurement. There have been several rounds of advisory provided to the banking industry since that initial guidance (OCC 2011-12, for instance). These guidelines provided detailed specifications of metrics and measures for ensuring sound internal rating systems for lending policy. These measures are now well understood, and these standards have broad applicability for any predictive modeling effort in the banking industry and elsewhere.
As an example, Credit Risk model guidelines require that model results should demonstrate sound measures of the stability of the population of customers for which loans are being rated, the performance of a model in terms of discriminating between good and bad historical outcomes, and calibration of the model to fit the historical event rates accurately.
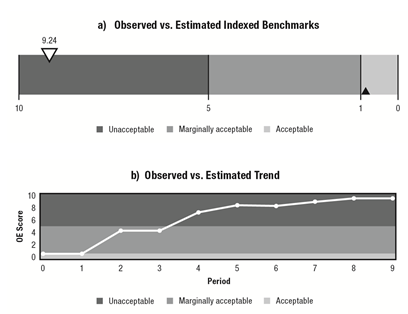
The examples in the two figures below are excerpted from a 10-page standard model performance report that Corios developed for the banking industry. This particular report tracks a model’s predicted scores, expected outcomes, and actual outcomes. This is an example of model calibration.
The two following charts (Chart A and Chart B) indicate how the original calibration of the model in time period 0 (indicated by the black indicator Chart A and the first time period on the X axis of Chart B) has worsened over time, by shifting into the red zone in both charts, and the time period in which the greatest dilution occurred (i.e., time periods 2 through 4 in Chart B).
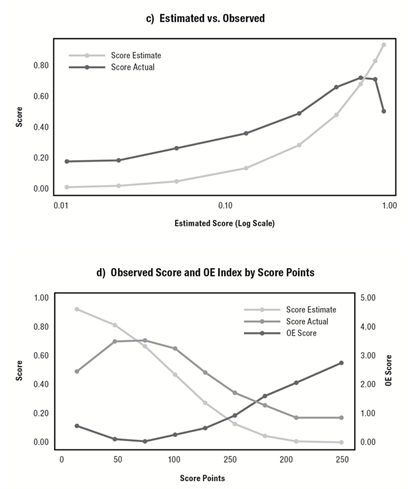
The subsequent pair of charts in the second figure indicates where in the risk distribution the greatest loss of calibration occurred. In this case, it occurs in the most risky part of the customer distribution. Specifically, on the right-hand side of Chart C, where the expected and actual scores diverge in opposite directions as well as where the observed-expected (OE) score is highest, as reflected by the green line in Chart D.
Combing the model workflow reporting with the model performance reporting and active mechanisms for keeping these reports up to date keeps all constituencies in the organization well apprised of the state of the businesses’ model inventory.
Lessons Learned From Experience with Model Monitoring and Performance
- Senior leadership has identified the lack of visibility into model inventories as a source of pressure that needs to be met now, rather than “a few years from now.”
- Leading organizations have developed detailed processes and workflows for tracking the model asset through its stages of development, review, approval, and retirement. They have also staffed the organization properly in order to deliver on those processes.
- Regardless of the presence of regulatory pressure, leading organizations have realized that models are worth hundreds of times (and sometimes more) over their development cost. They should have the proper mechanisms in place to manage these assets, comparable to managing other assets such as human resources or physical plants.
5. Deployment: Implementing Analytics Models via a Software Development Life Cycle
Many businesses struggle with implementing analytic models in production systems. This is often because analytics and IT tend to have few shared conventions or practices, despite each functional unit having relatively technical backgrounds. The companies that tend to excel in developing shared conventions and practices have cross-trained key staff in both functions. To excel, analysts should develop and maintain essential IT capabilities such as relational and distributed data modeling, application development, unit and system testing, version management, authentication systems, and program management skills.
The process of migrating a predictive model into production systems should follow a well-known practice used by IT teams, namely, the software development life cycle (SDLC). This process consists of specified phases, each consisting of tasks, with each task being iteratively developed, tested, documented, and hardened.
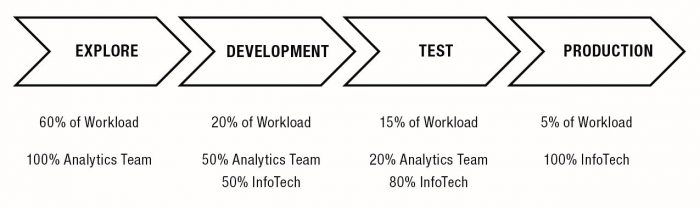
When applied to predictive modeling, we recommend adding an additional phase on the front end, called “Explore,” followed by the traditional Development, Testing, and Production phases. The rationale for the additional work is that the analytics team should pursue the heavy emphasis on data exploration, hypothesis generation, and evaluation as normal. This work should not be overlooked for its value in the credibility of the resulting model.
At the outset of the Explore phase, there is a great deal of uncertainty in the design and composition of the eventual model. As the process moves through Explore to Development and then on to Testing and Production, the final model asset to be implemented in production is much like the phrase attributed to Albert Einstein: “Everything should be kept as simple as possible, but no simpler.”
An example of the SDLC applied to predictive model development and deployment appears in the figure below.
Lessons learned from experience with model deployment provide best practices
- As much work as possible in model development and scoring table build should be moved into the database or data appliance. This will produce the best data development speed at production run time.
- Where possible, select a single platform for model development and deployment in order to reduce the quality assurance challenges that arise when translating from one platform’s code base to another.
- A key transition occurs in the Development phase, from validating the model training process into the model scoring process. The chief purpose of Testing and Production is in validating and hardening the scoring task itself.
- Track model performance for both model stability and learning whether accounts that receive on-demand scores are fundamentally different compared to the average or typical account. This should be done both on accounts that get scored on-demand during the day as well as on all accounts on a periodic basis.
- Improve quality assurance by using peer review, version and change management practices, and structured expectations for model documentation.
- Improve model interpretation by adding explanatory factors to the calculated score. These factors should explain to a person in the field why a given score is high or low so they can use the information to render a more effective application of the score in the decision the field person makes regarding the account.
Conclusion
Properly deployed models create measurable and significant financial benefits for businesses of all sizes and across all industries. However, many companies do not realize the full economic potential of their analytic model assets due to lack of adoption and failure to deploy them properly.
The fact is that your models should do more than improve understanding; they should drive business performance. The moment of truth occurs when analytic models are deployed and are used to drive customers behavior change. In order to make the most of their model assets, businesses must develop the common processes for communicating and integrating model deployment practices across multiple constituencies in analytics, IT, information security, and the customer-facing field.